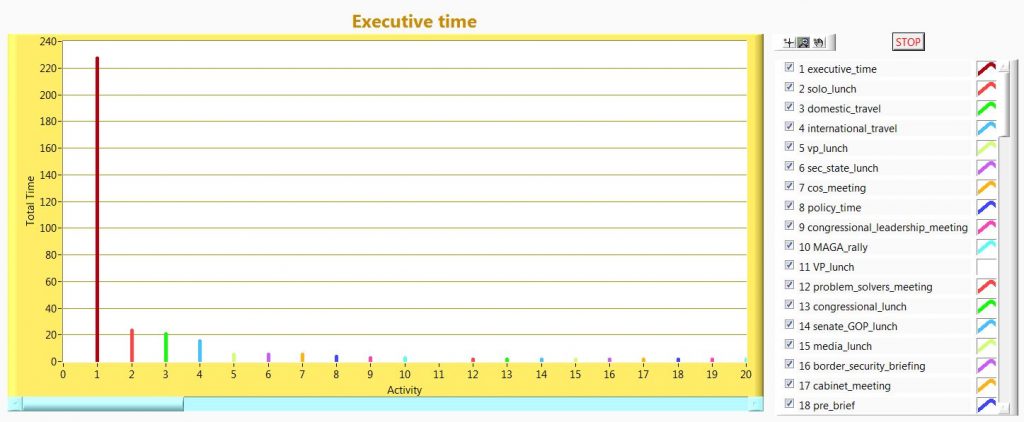
Executive time, leaked to the press, not such a great data set, but a good set of data for my seventh Makeover Monday. The single value is a huge outlier, if it were my data set I would have the team come up with a better set of metrics.
I thought about adding up like times, into meta groups, like meetings, lunch, rallies, etc … But one look at the data and the only lesson to be drawn is that executive time is the largest, by far.
UI Functionality and Design
This week I used a simple XY graph, with a lot for each data point. One could have put the data as a line and use the fill type lot, but I prefer the control of using each data point as a two point line starting at the zero position.
I need to find a better way to put names in the axis instead of numbers in graphs and charts.
Code and Article
Code : https://sourceforge.net/projects/data-world-labview/files/2-11-2019%20Executive%20Time/
Finale
Not a lot of frills on this one, sticking with a straight forward display of the data set. The subject matter did not have a lot of ins and outs to explore. On to the next week, number eight.