Minimum wage, my second Data.World entry. I completely ran out of time on this week.
My first several data sets I am going to continue with the theme of using the native LabVIEW FP controls.
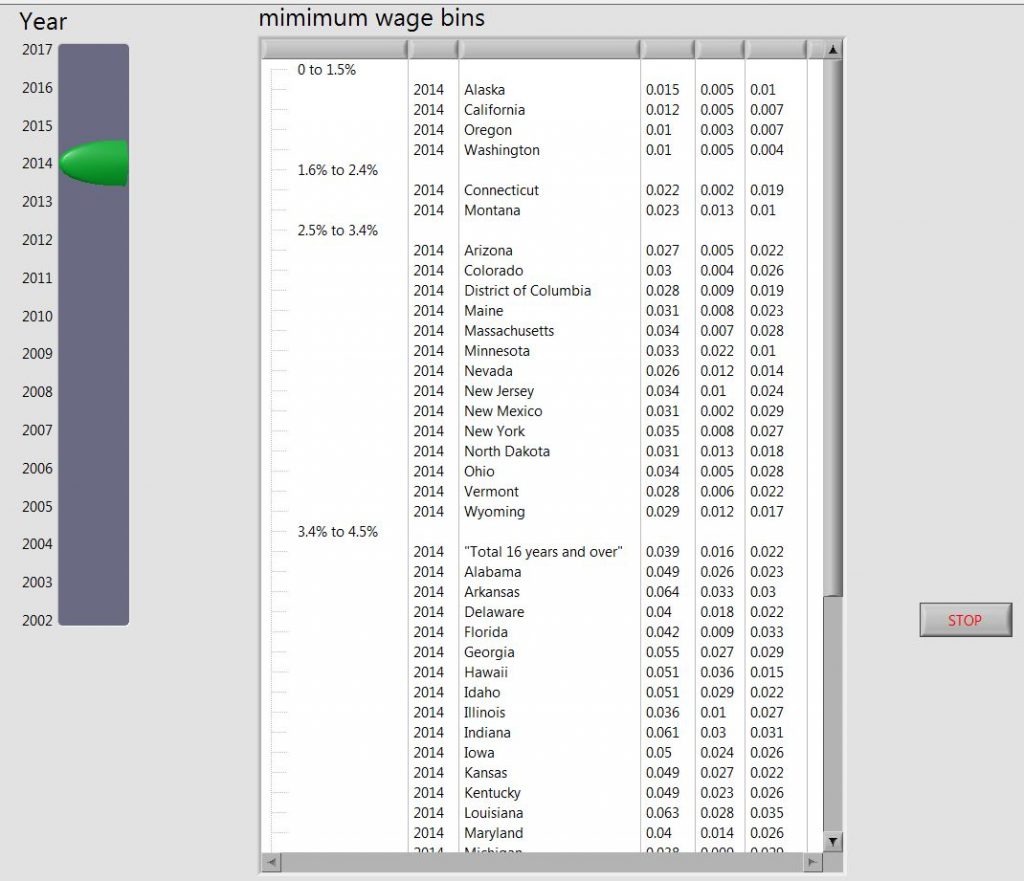
This week a slider and a tree are making an appearance. I set the slider to use actual numbers as the scales.
For those from Data.World a few LabVIEW pointers. Talking about the wires, is a reference to the code. LabVIEW is a visual data language, and the data flows along wires. The code looks like a circuit, to a certain extent, so thus the name wires for the data flow. The “pallet” refers to a small pop up window that shows all the functions that can be used in LabVIEW. So if you want to use a function that adds two numbers, the add function is on the pallet.
UI functionality
Click on the slider, to select a year, and the data for that year will display in the tree. Very simple.
I should have put the headers into the Tree so a person would know what the heck they are looking at. Well, I’m holding myself to a one week cut off. Also, I needed to put some cleaner looks on the slider and the Tree, they are really almost straight off the pallet.
Main Process and Development
I got caught up in the process of massaging the data. I developed an idea to use a three dimensional array, where each page was all the data for one state.
In this way, I could easily go to each page and pick out the year data.
The main loop uses a case structure to act on the change of the slider. When there is a change, the year selected is used to search each page.
For the code, I decided to force the code to have to look up all the sizes and ranges, and set the slider values. This way, if next year (week, etc…) we get a different data set, the slider will set itself to the range of years in the data, the number of stated, the number of columns, etc…. as much as possible.
I had to cut myself short, so the Tree Bins I hard coded from the article.
I can see how these data sets give a person a lot of choices on how to code, how much to focus on the wires and how much on the display. For this one I took to much of my limited time on the code, as opposed to the display.
For example, I decided to make two large arrays of the file data, one as text, the other as numeric data types, this way I didn’t have to continuously update the data type for display and use later on. However, since I stopped developing functionality, I ended up not using the numeric data type for calculations … I had been thinking about coding colors for states above or below the national average, or to also make a display of each states rate of change of their minimum wage data.
I did use the numeric data to bin the states, by comparing the state values against the bin values, for sorting the states into bins in the tree.
Code
Source Forge: 1-14-2019 minimum wage folder –> https://sourceforge.net/projects/data-world-labview/files/1-14-2019%20Minimum%20Wage/
Finale
I could put in another week on this, but gonna keep as is to stick with a one week timeline. First view of the slider and the tree. Spent a lot of time messing around with formatting the data. I wanted to preallocate all the arrays, even though this data set is small, I want to keep with the approach that I would use for large data sets, that is to reduce memory allocations and data copies.