Freedom of the press. My first run at the Data.World data set. I decided to use multicolumn tables, combo boxes, and XY Graphs. For the UI, I am sticking with the organic front panel controls, but colored to a very plain white look.
For those from Data.World a few LabVIEW pointers. A VI is a like a subroutine or a function. The Front Panel (FP) is what you see, and the Block Diagram is where the code is written.
My intent is to get up to speed at quickly making updates to standard User Interface elements. My first few projects will likely be me refreshing on some of the finer points of the UI elements, so there will be a lot of standard “looks” for a while.
UI Functionality
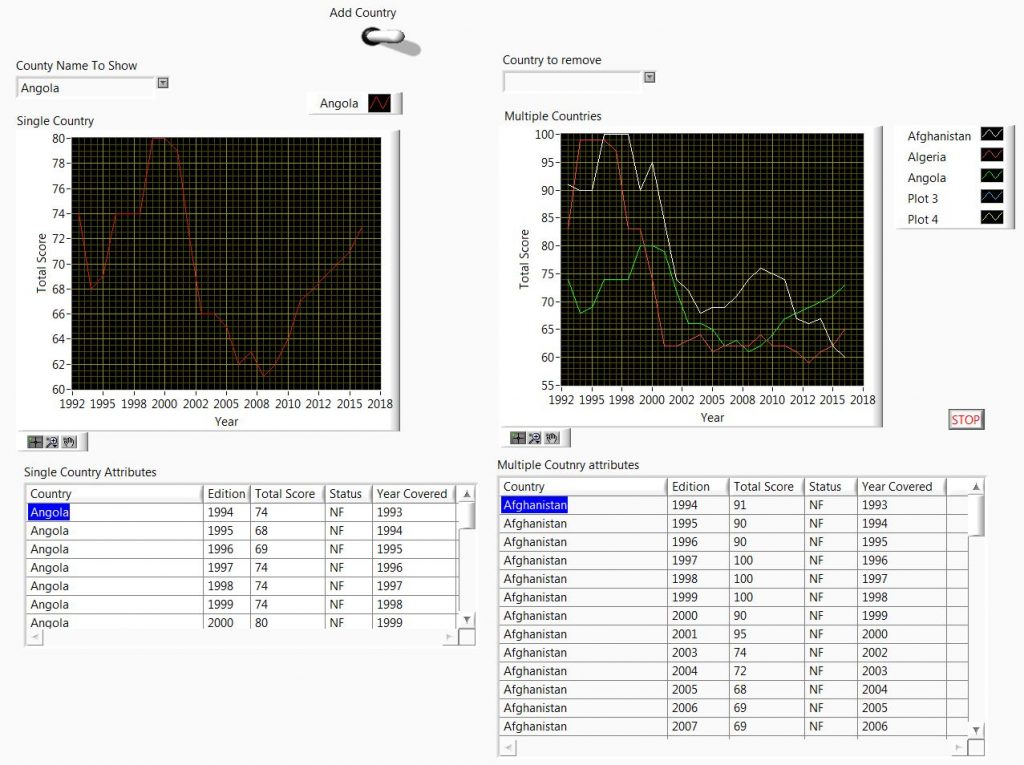
The main UI functionality will be to display a selected plot in one graph. I also wanted to be able to stack multiple plots, so I use a second graph to “stack” multiple plots for comparison. However, I use a switch to activate the addition of plots to the “stacking graph”. Finally I want to be able to remove plots from the “stacking graph”.
I wanted the user to be able to use the drop down feature of the combo boxes to select plots to show or add, and to select plots to remove from the stacked graph.
The three actions are 1) displaying or adding graphs from the full list combo box. 2) Removing plots using the ‘remove’ combo box. And 3) using the switch to turn on or off the the functionality for adding plots to the stacked graph.
Initialization
The Multicolumn tables require deliberate clearing, they can’t be simply reset with an “init all to default” command. I also set the active cell to the 0,0 point.
Generally each of the controls has to be set clear, and a lot of it can be done using the VI level ‘re-init to default values’ function. However, the combo box and the multicolumn list box are set to clear using their property nodes.
Graph inits are always intensive, having to clear the plot data and the plot names. In more complex plots, you might also set colors, line size, cursors, etc… So for this I made a subVI for all the actions needed. For this UI it was only plot names.
File Data
I created a subVI to read in the data, and then to arrange it into the format I felt would be the easiest to use for placing the data into the UI elements.
Main process
I decided to use a polling loop to look at changes in the combo boxes. These two changes would indicate that a new plot is to be displayed/added or that a plot is to be removed from the stacked plot.
During the update, if a new plot is selected, the switch is also checked to see if the country should also be added to the stacked plot. If the “county to remove” combo box is changed, then that country is removed : the plot, plot name, and the county name from the combo box.
The User Interface
Data world is all about displaying data. For this project I am displaying data using native controls. I was running short on time, so they are not as dynamic as the could be. To make them resizable, panels could have been used on the front panel.
The list boxes contain all the entries for each county year and year data.
I would probably change the graph background color too. A mental reminder to focus more on the UI than the code. Ha Ha, but I honestly ran out of time, I am making a point of cutting myself off by the end of the week.
Code
Sourceforge: https://data-world-labview.sourceforge.io
Development planning
I decided to do this all without a specification document. I paid the price, as I started with a simple polling loop, and then I wanted to add the functionality of plotting multiple countries, and realized that after I finished the VI, It was easier to make a second VI, more thought through, with the full functionality I wanted planned from the start, so that is why there is a “second try” VI file.
As this is more for my personal interests, I am using a ‘head first dive’ approach to planning. I find it to be a good gut check, and a way to get more lessons learned.
So far, the major functional sections each week will likely be: clear UI elements, read file data, format data to fit the functional and display plan, and then main processing implementation.
Also, for the first several I plan to force myself into using many different UI elements for the practice, and then make the UI look as intuitive as possible for the chosen elements.
Finale
I hope you all enjoy. More details to follow. I can see adding in data output functionalities. If I can get an intuitive functionality, and display the data as desired, it would be great to add the output, either files, reports, or both, that are based on how the user chooses to display, and what subset of the data they choose.